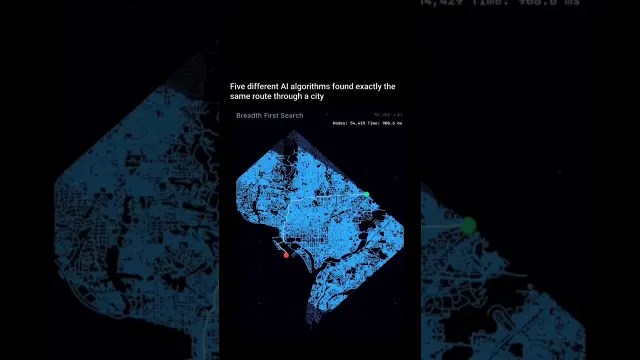
 Comparing Five Map Search Algorithms on City Street Networks
#Data Visualization
3 ideas
Comparing Five Map Search Algorithms on City Street Networks
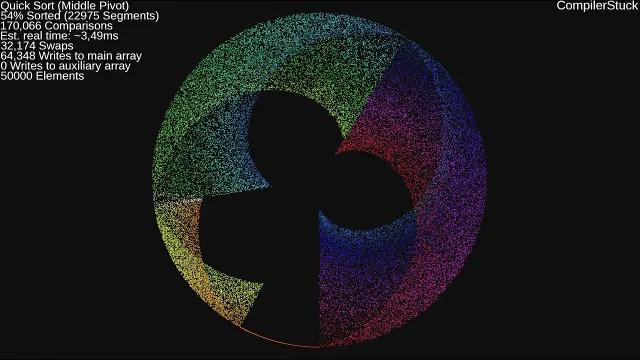 Visualizing Twenty Different Sorting Algorithms with Polar Coordinates
 Microsoft PL-300 Power BI Certification Explained for Data Analysts
Get new #Data Visualization ideas by email
Every Thursday: the week's best ideas, with the newest from #Data Visualization.
Related tags
Data Visualization Basics and Best Practices
Data visualization is the practice of turning data into charts, graphs, maps, and other visual forms that make information easier to understand. Instead of reading long lists of numbers, you can see patterns, differences, trends, and relationships at a glance. It is used in business, education, journalism, science, and everyday life whenever people need to make sense of information quickly.
What data visualization is for
A good visualization helps you compare values, spot changes over time, notice outliers, and understand how parts fit into a whole. It can also reveal questions you may not have thought to ask. For that reason, data visualization is not only about making information attractive; it is about making it clearer and more useful.
Different kinds of data call for different visuals. A line chart is often useful for changes over time. A bar chart works well for comparing categories. A pie chart can show parts of a whole, though it is best used only when there are very few categories. Scatter plots help show relationships between two variables. Maps are useful when location matters. Tables still have a place when exact values are important.
Read more
Main styles and common forms
You can think of data visualization in a few broad styles:
- Simple charts for quick comparison or trend reading
- Dashboards that combine several visuals for a broader view
- Infographics that mix charts, icons, and short text
- Maps for geographic data
- Interactive visuals that let the viewer filter, hover, or explore
Each style serves a different purpose. A single clear chart is often better than a complicated display full of effects. If the goal is understanding, simplicity usually wins.
What beginners should know
Start with the question you want to answer. Then choose the smallest visual that shows the answer clearly. A chart should match the data, not force the data into an awkward shape. Before adding color or decoration, make sure the labels, scale, and categories are easy to read.
It also helps to remember that visual design can change how people interpret data. A misleading scale, too many colors, or crowded labels can create confusion. Use color with purpose: to group, highlight, or separate information. Try to keep the same color meaning consistent across related charts.
Practical tips for clearer visuals
- Keep the title specific and informative
- Remove anything that does not help the reader understand the data
- Label axes and categories clearly
- Use a consistent scale
- Choose a chart type that fits the question
- Avoid too many colors, patterns, or effects
- Make sure the most important point is easy to see
If you are building a chart for others, think about what they need to learn in a few seconds. If the message is not obvious, simplify the data or try a different visual.
Learning to read and create visuals
The more you work with data visualization, the better you become at noticing what helps and what distracts. Good visualizations are accurate, clear, and honest. They respect the data and the viewer at the same time. Whether you are making a simple graph or a full dashboard, the goal is the same: help people understand information quickly and confidently.
Videos come from YouTube and posts from Instagram; titles and summaries are our own. All rights belong to their creators.