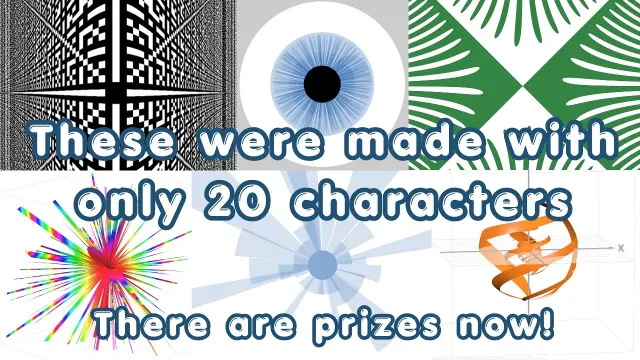
 Creating Impressive Mathematical Art with Desmos Graphing
#Graphing
1 ideas
Creating Impressive Mathematical Art with Desmos Graphing
Get new #Graphing ideas by email
Every Thursday: the week's best ideas, with the newest from #Graphing.
Related tags
Graphing: a Guide to Visualizing Mathematics
Graphing is the visual way of showing mathematical relationships, data, and change. Instead of only using numbers or formulas, a graph lets you see patterns at a glance. It can reveal whether values rise, fall, repeat, stay steady, or cluster in a certain way. Graphing is used in school mathematics, science, engineering, business, and everyday problem-solving.
At its simplest, graphing means placing points, lines, curves, or bars on a visual grid. The most familiar kind is the coordinate graph, where one value is shown on the horizontal axis and another on the vertical axis. This kind of graph is especially useful for equations and for comparing two related quantities. Other common graphs include bar graphs, line graphs, scatter plots, and pie charts, each serving a different purpose.
Main kinds of graphs
A line graph is often used to show change over time, such as temperature, sales, or growth. A bar graph is useful for comparing categories, like different groups or amounts. A scatter plot shows how two variables may be related, and it can help you notice trends or outliers. A pie chart shows how a whole is divided into parts, though it is best kept simple so it remains easy to read.
Read more
In mathematics, graphing is also used to draw functions. A function graph can show a straight line, a curve, a parabola, or more complex shapes. By looking at the graph, you can often understand the behavior of the equation more quickly than by studying the formula alone.
What to know as a beginner
If you are new to graphing, start by paying attention to the axes, scale, and labels. These tell you what the graph measures and how to read it correctly. A graph without clear labels can be misleading, even if it looks neat.
It also helps to think carefully about scale. If the numbers on an axis are spaced unevenly or chosen poorly, the graph may exaggerate or hide a pattern. Always check whether the intervals make sense for the data or equation you are showing.
When plotting points, be precise. A small error in placing a point can change the shape of a line or curve. If you are graphing by hand, use a ruler or a graph paper grid when appropriate. If you are graphing digitally, make sure the window or viewing range is wide enough to show the important parts of the graph.
Practical tips
- Choose the graph type that fits your purpose.
- Keep titles, labels, and units clear.
- Use consistent scaling on each axis.
- Look for patterns, not just individual points.
- If a graph seems confusing, check the scale and labels first.
Graphing becomes more useful the more you practice reading it. Once you get used to seeing relationships visually, graphs can make abstract ideas feel much easier to understand. They are one of the clearest ways to turn numbers into meaning.
Videos come from YouTube and posts from Instagram; titles and summaries are our own. All rights belong to their creators.