 AP Statistics Unit 1 Review for One-Variable Data and Collecting Data
#AP Statistics
13 ideas
AP Statistics Unit 1 Review for One-Variable Data and Collecting Data
 AP Statistics Unit 1 Guided Notes on Variables and Studies
 AP Statistics Unit 5 Review on Sampling Distributions
 AP Statistics Unit 4 Review on Probability and Random Variables
 Complete Statistics Study Guide Covering Main Topics in One Hour
 AP Statistics Unit 1 Summary Review of Exploring One-Variable Data
 Essential Prerequisite Skills and Expectations for AP Statistics
 AP Statistics Unit 1 Lesson on Quantitative Variable Distributions
 AP Statistics Unit 1 Summary Review for Collecting Data Methods
 AP Statistics Free Response Question Strategy and Context
 Comprehensive AP Statistics Full Course Review in Fifty Minutes
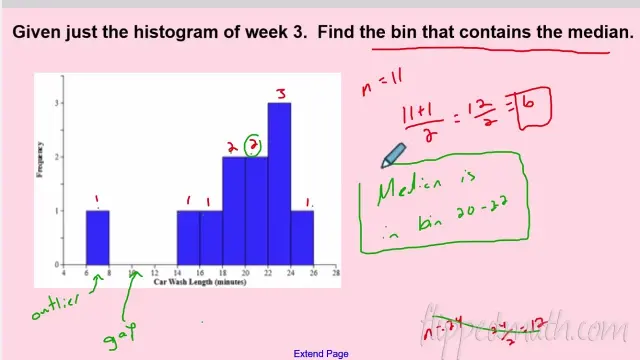 AP Statistics Summary Statistics for One Quantitative Variable
 AP Statistics Guided Notes on Density Curves and Normal Proportions
Get new #AP Statistics ideas by email
Every Thursday: the week's best ideas, with the newest from #AP Statistics.
Related tags
AP Statistics Guide
What AP Statistics is
AP Statistics is a high school course and exam that introduces you to the way statisticians collect, analyze, and interpret data. Instead of focusing mainly on exact answers, it teaches you how to think with data: how to design a study, how to spot patterns, how to measure uncertainty, and how to make conclusions that are careful and reasonable.
The subject has roots in probability, mathematics, and scientific research. It is used in many fields, including medicine, business, psychology, education, and social science, wherever people need to make decisions from data rather than from guesswork alone.
Main ideas in the course
Read more
AP Statistics usually centers on a few big themes:
- Exploring data: You learn how to describe distributions with graphs, center, spread, and shape.
- Planning studies: You look at surveys, experiments, and observational studies, and how to avoid bias.
- Probability: You study chance, random variables, and how likely outcomes behave.
- Sampling and inference: You use sample data to estimate or test ideas about a larger population.
- Relationships between variables: You examine correlation, regression, and how two variables move together.
A major part of the course is understanding that data can tell a story, but only if it is collected and interpreted carefully. A graph may look convincing, yet the design behind the data matters just as much as the numbers themselves.
What beginners should know
If you are new to AP Statistics, it helps to know that the course is less about advanced algebra and more about reasoning. You will still need comfort with formulas, but the bigger skill is knowing when to use them and what the result means in context.
A few habits make the course much easier:
- Read questions slowly and identify the context before doing any calculations.
- Always write answers in complete sentences when interpretation is needed.
- Pay attention to whether you are talking about a sample or a population.
- Check conditions before using a method, especially for inference.
- Learn vocabulary carefully, since many terms have precise meanings.
Common techniques and topics
You will often work with histograms, boxplots, scatterplots, normal curves, confidence intervals, and significance tests. You may also study how randomization helps reduce bias, why larger samples are usually more reliable, and how probability models connect to real-world uncertainty.
Some topics feel abstract at first, but they become clearer when you tie them to a situation: a survey of students, a medical treatment, a manufacturing process, or test scores from a class. AP Statistics is full of practical examples because statistics is ultimately about decision-making in the real world.
Study tips
The best way to prepare is to practice explaining your reasoning, not just getting the final number. When you review, try to answer three questions for each problem: What does the data show? What method fits? What does the result mean in context?
If you take your time with interpretation, learn the language of statistics, and practice often with real situations, the subject becomes much more manageable and much more useful.
Videos come from YouTube and posts from Instagram; titles and summaries are our own. All rights belong to their creators.