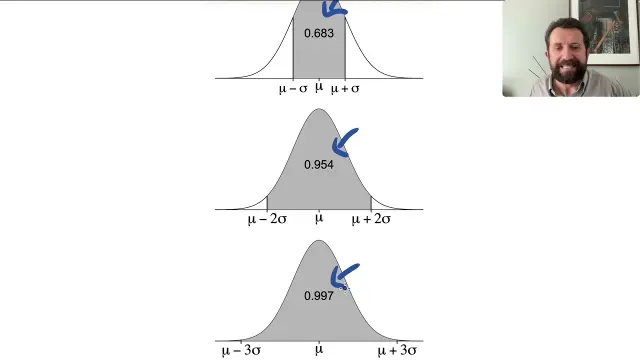
 Continuous Probability Distributions and the Normal Distribution Lecture
#Normal Distribution
13 ideas
Continuous Probability Distributions and the Normal Distribution Lecture
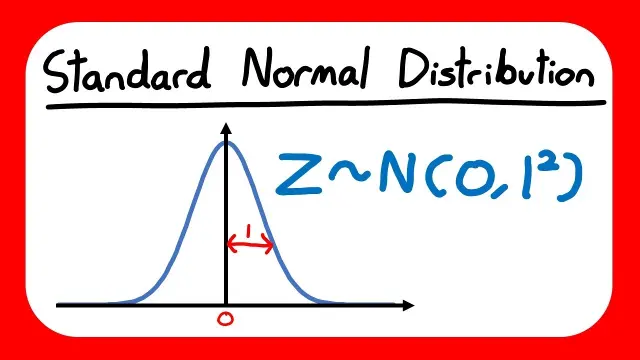 Working with the Standard Normal Distribution and Probabilities
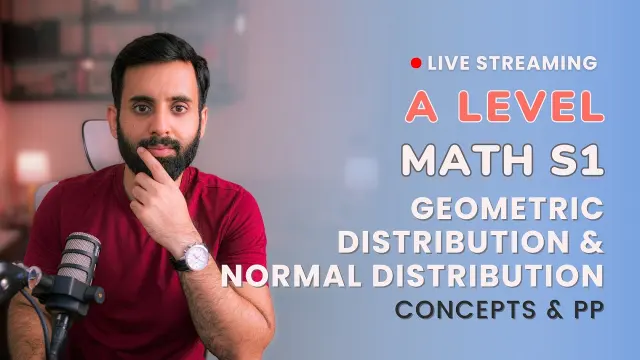 A Level Mathematics Concepts on Geometric and Normal Distributions
 Gym Equipment Wear Patterns Explained Through Normal Distribution
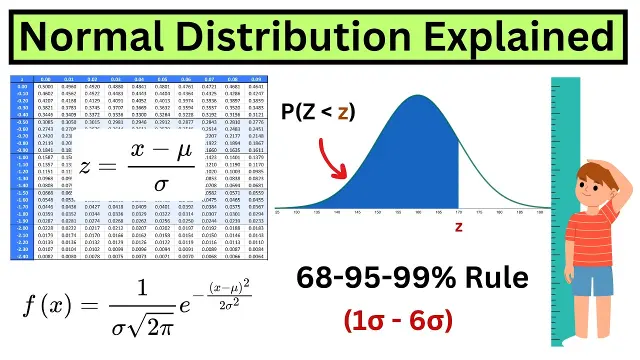 Comprehensive Explanation of the Normal Distribution and Bell Curves
 Finding Z-Scores Given Area or Probability Using the TI-84 Calculator
 Exam-Oriented Guide to Normal Distribution for Statistics Students
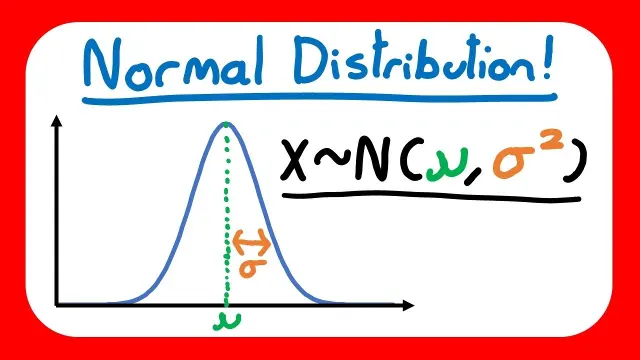 Normal Distribution Basics and Probabilities for A Level Maths
 AP Statistics Guided Notes on Density Curves and Normal Proportions
 How Randomness Creates Order Through Normal Distribution Experiments
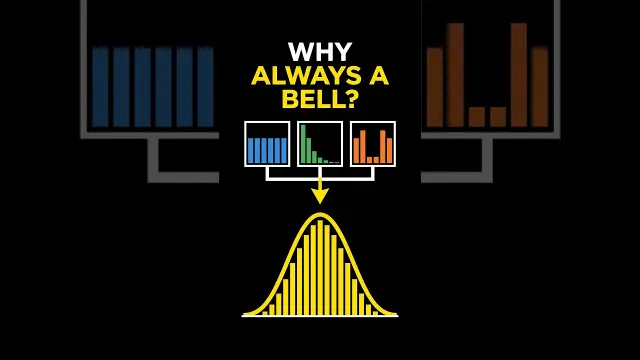 Why the Normal Distribution Appears Everywhere in Mathematics
 Normal Distribution Complete Revision for Class 12 Applied Mathematics
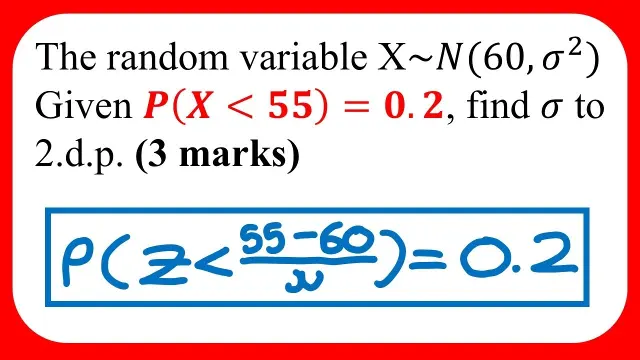 Finding Mean and Standard Deviation in Normal Distribution Problems
Get new #Normal Distribution ideas by email
Every Thursday: the week's best ideas, with the newest from #Normal Distribution.
Related tags
Normal Distribution Explained
What normal distribution means
The normal distribution is one of the most important ideas in statistics. It describes a pattern where values cluster around an average, with fewer and fewer values appearing as you move farther away from the center. When graphed, it often looks like a symmetrical bell shape, which is why people sometimes call it the bell curve.
You will meet this pattern in many areas of life, especially when a result is influenced by lots of small, independent factors. Height, measurement errors, test results, and many natural traits can often be described approximately by a normal distribution, although not every dataset fits it perfectly.
Why it matters
Read more
Normal distribution helps you understand how data is spread out. Instead of looking only at the average, you can also see how typical or unusual a value is compared with the rest of the group. This is useful in science, education, quality control, and research because it gives a simple way to describe variation.
A key idea is that most values tend to fall near the mean, while extreme values are less common. The spread of the curve depends on how much the data varies. A narrow curve means the values are close together; a wider curve means they are more spread out.
Main features of the curve
A normal distribution has a few defining traits:
- It is symmetric around the center.
- The mean, median, and mode are at the same point.
- The highest point is in the middle.
- The curve tapers off gradually on both sides.
- The total area under the curve represents all possible outcomes.
Because of these features, normal distribution is often used as a reference point for understanding data that is roughly balanced around an average.
Common uses and interpretations
In practice, normal distribution is often used to estimate how likely a value is, compare scores, or identify unusual results. It is also useful for standardizing data, which means converting values into a common scale so they can be compared more easily.
When you are reading a graph, look first at the center and then at the spread. Ask yourself whether the distribution is truly symmetrical, whether there are unusual outliers, and whether the data is continuous enough to suit this model. Many real-world datasets only resemble a normal distribution, so it is always worth checking rather than assuming.
What beginners should know
If you are new to statistics, start with the idea that normal distribution is a model, not a rule. It is a helpful way to describe many kinds of data, but it does not fit everything. Some datasets are skewed, clustered, or made of separate groups, and those patterns need different tools.
A few practical tips can help:
- Use a graph to see the shape of the data before drawing conclusions.
- Pay attention to the mean and the spread together.
- Do not assume symmetry unless the data clearly shows it.
- Remember that an average alone never tells the full story.
Once you understand the normal distribution, many other statistical ideas become easier to follow. It gives you a simple language for thinking about chance, variation, and what counts as typical.
Videos come from YouTube and posts from Instagram; titles and summaries are our own. All rights belong to their creators.