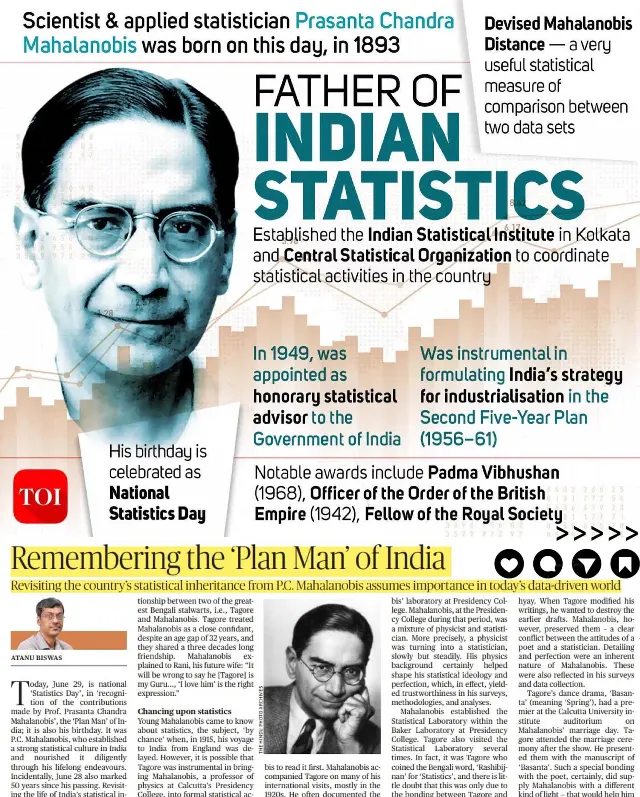
 Tributes to PC Mahalanobis on his birth anniversary and National Statistics Day
#Statistics
16 ideas
Tributes to PC Mahalanobis on his birth anniversary and National Statistics Day
Get new #Statistics ideas by email
Every Thursday: the week's best ideas, with the newest from #Statistics.
Related tags
Statistics: The Language of Data
What statistics is
Statistics is the branch of mathematics that deals with collecting, organising, analysing, and interpreting data. It helps you make sense of information that is too large, too messy, or too uncertain to understand by intuition alone. You meet statistics in many places: school results, surveys, weather reports, sports records, business planning, science, and everyday decision-making.
At its heart, statistics asks a few simple questions: What do the numbers say? How much variation is there? How reliable is the conclusion? And what might happen next?
Where statistics comes from
Read more
Statistics grew from practical needs: counting people, measuring land, tracking crops, and making decisions under uncertainty. Over time, it developed into a formal field with methods for summarising data and testing ideas. Today it connects mathematics, science, social research, engineering, health, and technology.
Because statistics works with real-world information, it is not only about exact answers. It is also about estimates, patterns, and probabilities. That makes it especially useful when outcomes are influenced by chance or when many factors are involved.
Main kinds of statistics
There are two broad sides to statistics:
- Descriptive statistics: methods for summarising data clearly
- Inferential statistics: methods for drawing conclusions from a sample about a larger group
Descriptive statistics often uses measures like the mean, median, mode, range, and standard deviation. It may also include tables, charts, and graphs that help you see patterns quickly.
Inferential statistics uses probability to make informed guesses about a population based on a sample. This is where ideas like confidence, error, and significance often appear.
Common ideas and methods
A beginner usually meets statistics through a few core ideas:
- Data can be numerical or categorical
- A sample is a smaller part of a larger population
- Variation is normal, so results are rarely identical
- Correlation means two things move together, but it does not automatically mean one causes the other
- Probability helps describe uncertainty and likelihood
You may also encounter distributions, especially the normal distribution, which is a common model for many natural and measured phenomena. Learning how to read a distribution is a useful step toward understanding statistics more deeply.
What beginners should know
If you are new to statistics, focus first on understanding the story behind the numbers. Ask what was measured, how the data was collected, and whether the sample is representative. A neat calculation is less useful if the data itself is weak.
It also helps to remember that statistics is as much about judgment as it is about formulas. Good analysis depends on clear questions, careful interpretation, and honest attention to uncertainty.
Practical tips
- Always check what the data actually represents
- Look for patterns, but do not ignore outliers
- Compare like with like
- Be careful with averages; one number may hide important differences
- Use graphs to support your understanding, not replace it
Statistics becomes much easier when you treat it as a way of thinking. Instead of asking only what happened, ask how sure you are, what the data can and cannot show, and what questions still remain.
Videos come from YouTube and posts from Instagram; titles and summaries are our own. All rights belong to their creators.